Digital Readiness Accelerator:

Digital Innovation Fund Research Project

This online synopsis shares key highlights from the Digital Readiness Accelerator project. For a complete view of the analysis, findings, and project insights, access the full report.

Summary

The Digital Readiness Accelerator is a Rapid Demonstrator research project undertaken by EDGE Digital Manufacturing (EDGE) and funded through the Digital Innovation Fund of the Smart Manufacturing Data Hub (SMDH), a Made Smarter Innovation-funded innovation hub that supports small and medium-sized (SME) manufacturers to become more competitive.

The Digital Readiness Accelerator project investigated the correlation between readiness to adopt data and technologies (digital readiness) and business performance in manufacturing. The project team worked alongside SME manufacturers to build an evidence-based improvement framework.

The Core Hypothesis

The project tested the hypothesis that SMEs that implement a holistic digital transformation strategy across multiple dimensions and promote cross-functional collaboration are more likely to achieve superior business performance, innovation, and operational efficiency compared to SMEs which focus on isolated digital initiatives or limited departmental collaboration. The research explored performance indicators to measure activities that can increase SME manufacturer confidence and reduce risks inherent in digital investment and adoption.

The research sought to identify operational activities, interventions and indicators SMEs should focus on; and to quantify the benefits that can be achieved through these actions.  Ultimately, research findings informed the development of a prototype Digital Readiness Impact Calculator.  The concept of this calculator was to enable manufacturers to evaluate the benefits of digital technologies and readiness activities, helping them to build solid business cases for digital transformation.


Participants invested time and financial resources to understand their digital readiness and business performance, further develop their digital roadmap and implement data and digital projects in their business while benefiting from consulting support, peer learning and networking and industry recognition.

SECTION 1

Digital Readiness

Digital Readiness and Barriers to Adoption

Digital Readiness is a measure of maturity in adopting digital technologies (British Standards' PAS 1040: 2019). Digital Readiness is used to benchmark and track growth in the digital maturity of individuals, teams and businesses over time, with a higher readiness level indicating a capability to achieve business benefits from data and digital technologies.

Digital technologies and their potential to drive productivity improvements are increasingly well defined, for example in the Made Smarter Review 2017 and in British Standards' PAS 1040 on Digital Readiness. However, a range of organisational and personal barriers can hold back manufacturing companies from adopting data and digital technologies and fully realising the business benefits, including those outlined below.

STRATEGIC/ COMPANY BARRIERS

OPERATIONAL/ TEAM BARRIERS

CAPABILITY/ PERSONAL BARRIERS

Limited access to innovation;


Level of perceived risk;


Intellectual Property Concerns;


Concerns about adopting non-standard-solutions;


Concern over staff reaction;


Cultural change

Skills shortages


Limited empirical evidence


Lack of clear vision, strategy and leadership


Lack of knowledge of non-financial benefits;


Perceived cost adoption;


Low priority versus day-to-day business challenges;


Unclear economic benefits;


Lack of certainty of solutions working;


Finding the right partners;


Lack of confidence in supplier claims


Lack of employee engagement


Fear of job losses

Lack of time;


Limited knowledge;


Lack of tech skills to design and implement new systems;


Lack of innovation from existing staff;


Lack of skills to operate new

technologies;


Lack of awareness of new solutions

Expand table

Indicative List of Manufacturing Metrics and KPIs6

In addition to the above, EDGE’s work with SME leaders revealed common implementation questions to navigating digital adoption, including:

  • Where do I start?

  • How do I make the right decision?

  • How do I choose the right technology?

  • Where can I find the right people?

  • Who can I trust to help me?

  • Will this investment deliver a return?

  • What about my customers?

  • How do I fit this in with the day-job?

Digital Readiness Themes

Digital Readiness is a comprehensive framework built around five themes and covers of all aspects of the manufacturing value chain and business dimensions influenced by digital adoption, including leadership vision, culture of innovation, technology integration, processes, systems, collaboration, skills, workforce performance, operational performance and partner performance.

Leadership

An effective vision sets out priorities for how digital technologies can deliver benefits in specific roles and business-wide. A culture of collaboration, innovation and experimentation is needed to fully realise these benefits. 

Leadership

An effective vision sets out priorities for how digital technologies can deliver benefits in specific roles and business-wide. A culture of collaboration, innovation and experimentation is needed to fully realise these benefits. 

Leadership

An effective vision sets out priorities for how digital technologies can deliver benefits in specific roles and business-wide. A culture of collaboration, innovation and experimentation is needed to fully realise these benefits. 

People

Investing in the workforce and planning adoption of digital technologies together with employees can ensure that digital technologies are adopted and used to the benefit of the whole business. Real-time insights from data from digital technologies can provide objective, unambiguous and bias-free support to individual and team performance management.  

Technology

Effective adoption of digital technologies requires a relevant and up-to-date understanding of current IT systems and IT infrastructure including IT support as well as staying up to date about emerging technologies. Planning and training for new systems helps ensure successful implementation and adoption.

Operations

Businesses can access and use data to enhance business operations and make processes more efficient and create customer value. Data analytics, through machine learning and artificial intelligence, can use computing power to proactively detect maintenance needs and find solutions to complex problems impacting the business.

Partners

Digital Technologies enable stronger communication with customers, suppliers and partners and can allow for greater customisation and flexibility and more automation, reducing the need for manual intervention.  Careful technology integration with consideration given to data sharing, data security and intellectual property helps all parties realise greater benefits.

Companies can evaluate their digital readiness via a number of tools. EDGE’s Digital Readiness Assessment Tool is one self-assessment tool available to UK manufacturers. The tool aligns with the dimensions and framework found within PAS1040 and has been used by over 1000 business leaders across all UK regions.

Digital Readiness Analysis and Initial Findings

From the 1000 users, we compiled a dataset of 746 company responses to provide a research dataset for the Digital Readiness Accelerator project. This dataset is representative of the full dataset but excludes incomplete data and partially completed responses. We undertook extensive analysis of the dataset using a range of techniques which including basic linear regression and use of artificial intelligence and machine learning. Our analysis sought to address the following questions:

  • What correlation exists within the underlying questions?

  • What patterns or clusters exist within the dataset?

  • Which aspects of digital readiness (questions or themes) have a greater impact?

  • Do any specific questions or themes show a greater impact on digital readiness

The probability density from our sample has been used as the basis for establishing a percentile benchmark score for each company based on their Digital Readiness Score.


The distribution of scores across businesses in EDGE’s data set follows a Gaussian distribution. In addition, examination of the average score for each theme (using raw scores based on the Likert scale of 0 to 5) shows operations and partners typically lagging leadership, technology and people.

Distribution of Digital Readiness Scores
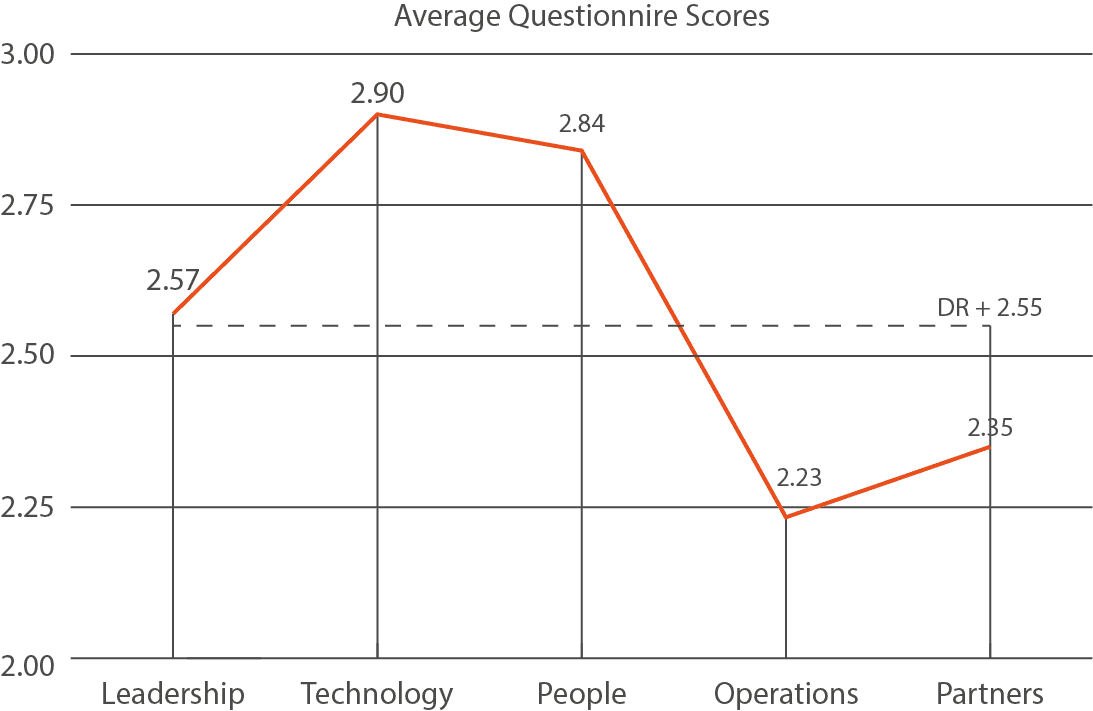
Digital Readiness Score - Theme Averages

The data demonstrated clear correlation within each of the diagnostic themes, with correlations generally stronger closer to the diagonal. Further analysis by SMDH data scientists identified inter-correlated groups of questions. These generally aligned with the 10 aspects of digital readiness identified in PAS1040. Where questions showed strong correlation with another group this could be explained by an overlap in the type of technology (e.g., data risk is explored in the Operations theme but correlates with the Partners theme; questions relating to internet of things, connectivity, sensors and tracking are included in the Operations theme but also correlate with the Partners theme).


Other analysis undertaken by the data science team included Clustering (a technique used to find similarities within datasets); Symbolic Regression (a type of regression analysis that searches for mathematical expressions to represent a given dataset); neural networks, decision tree and random forest regression.


One interesting finding was on the importance of the Partners dimension on overall digital readiness. In two separate analyses, questions within this dimension showed the greatest feature importance. Further work would be required to validate these initial findings.


Further data and discussion around the data analysis methods and initial finding are included in the full research report.

SECTION 2

Business Performance

Key Performance Indictors and Data Collection

As a starting point for business performance, we identified a comprehensive list of key performance indicators (KPIs) in a literature review with a focus on manufacturing and operational data.

KPI

Description

Throughput

Measures production capability

Cycle Time

Evaluates production duration

Demand Forecasting

Assesses raw material estimation

Takt Time

Reflects customer deadline adherence

Return on Assets

Indicates asset utilization

Capacity Utilization

Quantifies production capacity

First-Pass Yield

Ensures quality assurance

Overall Equipment Effectiveness (OEE)

Gauges manufacturing productivity

Overtime Rate

Monitors scheduling and staffing

Manufacturing Cost

Analyses profitability

Work in Process/Progress

Tracks working capital

Inventory Turns

Measures resource effectiveness

Production Attainment

Evaluates production target achievement

Cash to Cash Cycle Time

Considers time-based profitability

Avoided Cost

Estimates cost savings

Changeover Time

Measures task-switching duration

Machine Downtime Rate

Captures operation snapshots

Percentage Planned Maintenance

Assesses maintenance ratio

Downtime to Operating Time

Evaluates maintenance effectiveness

Manufacturing Cost Per Unit

Calculates production cost

Material Yield Variance

Compares material usage

Maintenance Cost Per Unit

Analyses production efficiency

On-Time Delivery

Reflects customer satisfaction

Health and Safety Incidence Rate

Focuses on workplace safety

Employee Turnover

Monitors employee retention

Non-Compliance Events / Year

Ensures regulatory compliance

Customer Returns (Rejects)

Captures customer feedback

Total Manufacturing Cost Per Unit (excluding materials)

Considers fixed production costs

Energy Cost Per Unit

Addresses environmental impact

Scrap Rate

Aims for waste reduction

Expand table

Indicative List of Manufacturing Metrics and KPIs

Following our desktop literature review, we encountered several limitations and research challenges with our proposed approach. Discussions with companies in our research cohort failed to determine any specific trends or consistent methods used to capture and monitor key performance indicators. Our core focus was to build a dataset which might support development of our proposed Digital Readiness Impact Calculator, so we pivoted our approach to address some of our research challenges at this phase, electing to use Winning Moves’ Benchmark Index® to streamline and standardize KPI data collection.

STRATEGIC/ COMPANY BARRIERS

OPERATIONAL/ TEAM BARRIERS

CAPABILITY/ PERSONAL BARRIERS

No standardised metrics

Our literature review and manufacturer conversations did not identify formal standards across the sector for business performance in manufacturing.

Following a review of potential KPIs, used an existing benchmark tool, Benchmark Index®.

Manufacturing metrics

Companies in the research cohort did not regularly or consistently track manufacturing KPIs e.g., Overall Equipment Effectiveness (OEE), On-Time-In-Full (OTIF) delivery, Non-Conformances, Waste, Energy Use.

Use of Benchmark Index® provided a neutral and consistent calculation for key metrics.

Data privacy

Concern with sharing proprietary quantitative performance data.

Use of Benchmark Index® overcame the need to share ERP data.

Lack of real-time operational data

Only a few companies in the cohort track real-time data.

Data projects were identified in roadmapping activities.

Breadth of project data and analytical approaches

The Digital Readiness diagnostic covers all aspects of a business and could correlate with a wide range of business KPIs.

Decision taken to narrow our focus and leverage readily available KPIs (e.g., financial performance, Benchmark Index®)

Lack of before and after data

Initial designs for the impact calculator assumed availability of data relating to digital readiness interventions and before and after digital readiness metrics.

Decision taken to focus on a point in time analysis and drill deeper into key factors influencing digital readiness and business performance.

Aligning digital readiness and business performance data

Initial data scope more complex than envisaged during the proposal stage.

Decision taken to simplify approach.

Expand table

Research Challenges and Mitigating Actions

SECTION 3

SME Perspectives

The challenge

We set out to recruit a cohort of businesses to test our core hypothesis and build an initial dataset. We targeted up to 12 SMEs for this cohort to provide a breadth of company sizes and sectors with different levels of digital readiness and business performance. 

The planned customer journey built on EDGE’s existing Digital Breakthrough methodology to help businesses understand their needs and develop an actionable digital roadmap. Businesses would be signposted to relevant support including Made Smarter Adoption and regional funding programmes; introductions to catapult centres and research organisations; training and development content including various fully funded platforms delivered by SMDH, SMDH partners including Hartree and Datalabs; and other Made Smarter Innovation hubs/research centres such as the Digital Supply Chain Hub.

Initial Research Cohort Activities

Businesses were encouraged to complete a digital readiness baseline diagnostic and the Benchmark Index® Manufacturing Excellence diagnostic. Data from these two diagnostic tools would provide the basis for our initial research into correlation between digital readiness and business performance.


Engagement of the cohort varied across different activities. Peer to peer engagement was the most popular aspect as demonstrated by the data and anecdotal feedback. Engagement with KPIs was challenging and although nine companies engaged in the process, only one company was able to provide a full set of data to all the sections.

Data and Digital Readiness Projects

Cohort members pursued a variety of digital readiness activities.  These activities emerged from the roadmapping workshops. SMEs were signposted and referred to additional support including catapults, SMDH, and technology providers with relevant solutions.

Indicative Data and Digital Readiness Projects

Company Sector

Company Size (FTE)

Digital Readiness Themes

Digital Readiness Activities

Rationale / Expected Impact

Aerospace

Small (10-49)

People

Employee engagement survey

Improve culture of innovation

Industrial equipment

Medium (50-249)

Technology

Data cleansing

Data analytics

Improve data quality to enable analysis and use of AI/ML to improve understanding of operations and customer opportunities

Cosmetics

Small (10-49)

People,

Technology

Piloting new systems in HR and product data

Data analytics

Automation, efficiencies, increased confidence to use technology

Use existing customer and product data to increase sales

Precision Engineering

Small (10-49)

Operations,

People

Measuring team digital readiness

Piloting new systems including machine monitoring and automated quoting

Identifying digital champions

Data analytics

Automation, increased machine utilisation, improving lead times

Identifying personal development areas

Involving team in digitalisation journey

B2C products

Medium (50-249)

People,

Technology

Skills and training

Recruitment

Ongoing investment in core systems

Data analytics

Improve confidence and awareness across the team

Build in-house technical capability

Optimise use of existing systems

Use data to generate insights about customers and market opportunities

Services

Micro (1-9)

Technology

Explore new ERP system

Digitalise processes

Energy sector

Medium (50-249)

Partners

Collaboration and knowledge sharing with suppliers

Improve supply chain resilience

Various

Various

Leadership

Update digital roadmap

Clarity of vision

Communications with team

Precision Engineering

Small (10-49)

People

Training for new system

De-risk transition to new system

Improve staff confidence in new technologies

Commercial Vehicles

Small (10-49)

Technology

Data protection and Intellectual Property protection

Clarity on how to protect proprietary data

Expand table

Case Studies

A number of impactful case studies emerged from the data and digital readiness projects. Please refer to the full report for additional examples beyond the two profiled here.

Case Study – Digital Readiness and AI Adoption

BACKGROUND

Manufacturing leaders are under pressure to explore and understand the opportunities from artificial intelligence for their organisation. Fear of missing out is creating a burning platform, but leaders are also wary of making the wrong choices and finding it challenging to navigate a complex landscape of technologies, solution providers and regulatory/legislative requirements.

DIGITAL READINESS ACCELERATOR PARTICIPANT

Growing Industrial Equipment manufacture with 70 FTE and a medium to high digital readiness. Early adopter with strong experience of digital adoption across the business.

ACTIVITIES UNDERTAKEN

Review of existing digital roadmap. Consultation with department sponsors regarding current pain points. Exploration of potential artificial intelligence use cases.

APPROACH

Scored opportunities were scored to enable prioritisation against a clear set of criteria. Digital readiness activities helped the business to develop a project shortlist and communicate this with key stakeholders.

DIGITAL READINESS DIMENSION

Leadership dimension of PAS1040 (leadership vision; culture of innovation).

Case Study – Engaging people in digital transformation

BACKGROUND

Supply chains are experiencing disruption leading to increased lead times, costs and inefficiencies. There is growing pressure to identify cost savings and to improve environmental sustainability. Supply chain digitalisation requires co-operation and collaboration with customers and suppliers.

DIGITAL READINESS ACCELERATOR PARTICIPANT

Growing manufacturer active in the aerospace sector. 20 FTE and a medium to high digital readiness. Early adopter with strong experience of digital adoption across the business.

ACTIVITIES UNDERTAKEN

Review of digital roadmap and digital transformation plans. Identification of employee engagement as a blind spot within the business.

APPROACH

Reviewed different approaches to employee engagement; adopted an employee engagement survey.

DIGITAL READINESS DIMENSION

People dimension of PAS1040 (skills, workforce performance). Leadership dimension of PAS 1040 (culture of innovation)

Peer Group Feedback

Four areas of common interest arose from the cohorts’ projects and business priorities: (1) the practicalities of AI adoption, (2) data-driven business strategy, (3) employee engagement and workforce performance management tools, and (4) data sources and opportunities (digital twins and cobot deployment).  These became focus topics for four peer exchange sessions where participating SME leaders shared their experiences, identified challenges and use cases, adoption considerations and potential actions.


In addition, a number of cross-cutting themes emerged from the peer workshop sessions with cohort members, including:

1. Balancing Technology with Human-Centric Approaches:

Importance of integrating AI and digital tools as supplements to, not replacements for, human input.

2. Leadership and Change Management:

Leadership plays a pivotal role in driving adoption and addressing cultural resistance.

3. Skills and Training:

Need for upskilling and hands-on support to build trust and confidence in new technologies.

4. Data Management and Integration:

Challenges with integrating diverse datasets and ensuring data quality. Governance and security concerns, particularly in sensitive sectors.

5. Iterative Experimentation:

Starting with focused trials, learning from small successes, and scaling gradually.

6. Customer-Centric Innovation:

Leveraging data and AI to better understand customer needs and improve service.

7. Cultural Resistance to Digital Change:

Overcoming scepticism with transparent communication, clear benefits, and continuous engagement.

These themes underscore the multifaceted nature of digital readiness, requiring a blend of technological, cultural, and strategic actions to drive meaningful progress in manufacturing.

Validation Cohort

We ran a series of regression analyses looking at the correlation between different business performance variables and digital readiness. Whilst there were no significant correlations observed, several variables demonstrated some correlation.


The KPI Percentile calculation comprised an average of all the qualitative and quantitative business performance questions. This also did not show any correlation with digital readiness, suggesting that our core hypothesis could not be proven from our initial research cohort data.


We ran the same regression analysis on the larger dataset as we did with the initial research cohort. Due to incomplete data, only 22 of the companies were included in this analysis but their average digital readiness and business performance was broadly the same as the full dataset (59th percentile and 62nd percentile respectively).


It is important to note that the dataset used for this analysis was extremely small and therefore the results are not reliable.


The original intent of the validation cohort was for up to 40 SMEs to validate the preliminary findings from the initial cohort. However, as the initial data did not identify a clear measurable link between digital readiness and business performance, the validation research phase evolved to focus on building a larger dataset to enable further analysis and provide a reference benchmark for the calculator. To achieve this data collection objective, EDGE invited SMEs to complete a Digital Impact Survey, a shorter diagnostic combining digital readiness and business performance questions.

Validation Cohort correlations observed between business performance variables and digital readiness (with Initial Research Cohort results included for comparison)

Dependent variable

Validation Cohort R-squared

Initial Research Cohort R-squared

Total Turnover per FTE - Percentile

0.20

0.0003

Scrap Rate – Percentile

0.08

0.65

ICT Expenditure Per Employee - Percentile

0.19

0.27

Sales Growth – Percentile

N/A

0.22

Training Expenditure To Turnover - Percentile

0.06

0.20

Energy Costs to Turnover – Percentile

0.02

0.18

Total Leavers Per FTE Employee - Percentile

0.14

0.17

Absenteeism Per FTE Employee - Percentile

0.35

0.11

R & D Expenditure To Turnover - Percentile

N/A

0.10

KPI Percentile

0.03

0.03

Capital Investment To Turnover - Percentile

0.02

0.0031

Expand table

Scatter Graph showing Digital Readiness Percentiles and KPI Percentiles

Additional detail on the initial cohort and the validation phase may be accessed in the full report.

Further Reading

Please refer to the full report to read more about highlights from the peer discussions and inspiration from businesses that are tackling these business challenges and opportunities.

You may also download the reflective exercise and roadmap template to start your own data and digital readiness journey.

SECTION 4

Findings and Recommendations

Summary

The project covered a broad scope and proved to be significantly more complex than envisaged at the outset. Looking at the challenges encountered, some (e.g., client engagement) were anticipated with mitigating actions deployed during the project. Others (e.g. access to data) were more pronounced than envisaged and even led to new strategies and approaches for the project.

Throughout the project, we focused on four core objectives:

Developing our understanding of digital readiness and our existing dataset

Providing digital readiness support to the research cohort

Building new datasets with digital readiness and business performance data

Innovation activities to develop a Digital Readiness Impact Calculator

Digital Readiness

Analysis of our existing digital readiness dataset helped to generate new insights about our data and to develop internal data science capabilities. We were able to share outputs as a demonstration of the art of the possible of AI and ML techniques on business data to SME manufacturers in the research and validation cohorts.

From the analysis we were able to draw the following conclusions:

The Gaussian (normal) distribution suggests that although we have adopted a Likert scale of 0-5, there is less nuance within the scale so a Yes/No question format may be just as effective to measure Digital Readiness.


The correlation between questions within a theme suggests that although the additional detail provides valuable insights about the company and specific actions and areas of readiness; it may not be necessary to assess their overall Digital Readiness score.


The diagnostic could be improved by asking questions randomly and through use of control questions. This improvement would need to be balanced with the additional burden on users of the tool.


The analysis has given us confidence to select the 5 identified questions (1 per theme) as the basis for a simplified Digital Readiness survey to incorporate into our Digital Readiness Impact Calculator prototype. Whilst this subset will not provide the level of detail or accuracy as 40 questions, it should be sufficient for its intended purpose.


Further analysis could inform appropriate weightings for each question and may lead to a more complex algorithm than looking at the simple mean.

Business Performance

We observed the importance of this topic through our engagement with SMEs during the project and in our dissemination activities. Businesses are keen to improve in this area and recognise the requirement to improve the quality of current data (e.g. by undertaking data cleansing projects); to capture more relevant data (e.g. by implementing sensors) and to use their data to support decision making (e.g. by using artificial intelligence and machine learning techniques).


Current maturity levels are reflected in our digital readiness data (Figure 5) where we see the Operations theme scoring lowest for average digital readiness. This is the theme where questions relating to real-time data and use of data analytics technologies are explored and assessed.

Core Hypothesis

Central to this project was a hypothesis that digital readiness can impact business performance. Our data was insufficient to demonstrate a conclusive direct correlation and identify an algorithm or formula aligning digital readiness and business performance. However, the data did show evidence that certain factors may be related which could be further tested with a larger dataset.

Factors we would want to explore further included:

  • Leavers and Absenteeism which could suggest a link between digital readiness and employee wellbeing, engagement and motivation

  • ICT investment which would intuitively seem to be related to digital readiness

  • Sales growth demonstrated higher correlation in the initial research cohort but was not included in the validation cohort due to insufficient data

  • R&D expenditure demonstrated higher correlation in the initial research cohort but did not make the final shortlist for the Digital Impact Survey

We are undertaking further data analysis to explore a more complex algorithm based on our initial data. This work will continue with support of the University of Birmingham and Winning Moves.

Recommendations for Improved Future Research

Here we outline recommendations for how project outputs could be scaled up as part of wider industrial research to develop a market ready impact calculator.

1. Longitudinal study for ongoing monitoring and data collection

A limitation of the study was the focus on a single point in time as it was not possible to undertake a before and after comparison within the compressed project timeline. Companies involved a project such as this could be approached at regular intervals (e.g., annually) to capture longitudinal data and enable monitoring of the impact of digital readiness activities undertaken and enabling before and after data analysis.


Additional questions could be considered to capture further details of specific activities undertaken, digital investment projects implemented, and digital adoption support received to build a more robust profile of successful enabling actions.


It may also be possible to incorporate a longitudinal study as part of monitoring and evaluation activities for existing business support programmes such as Made Smarter Adoption.

2. Budgeting for data acquisition and client management

Additional resource and budget to support more hands-on data collection could increase certainty and comprehensiveness of data collection efforts. Other benefits of a more hands-on approach would include ongoing client relationship management which could lead to identification of data projects and other business support interventions as gaps in existing data and systems are uncovered.

3. Develop a larger business performance dataset

This project was limited in scope with budget to engage with 12 SMEs in depth over 8 months. Given lessons learned around study costs and effective company engagement, we estimate a full project would require 18 months minimum and larger research budget.


Partner with other research institutions to leverage existing and planned activities8. This could include leveraging existing datasets such as Benchmark Index®, Companies House and commercially available data to build a dataset of 1000+ organisations.

4. Randomised control trial

A randomised control trial would enable better identification of which activities and actions lead to the greatest impact on digital readiness. Control groups could be established to investigate the impact of specific interventions, with such a study capturing qualitative and quantitative data points.

5. Digital Readiness Impact Survey

The existing digital impact survey could remain open and be used to support several objectives:

  • Grow the existing dataset and support more accurate correlation calculations

  • Lead generation tool for SMDH and other digital adoption and innovation programmes

  • Benchmarking programme participants

Questions could be refined to align with new insights, e.g., from further analysis of larger business performance datasets.


The survey structure could be enhanced, e.g., using drop-downs, to make it easier for SMEs to respond and provide accurate information.


It may also be possible to enhance the survey with a results and report page so that users receive some immediate feedback and recommendations, similar to the full digital readiness assessment tool. This could be integrated with the data provided by the users and a database capturing all responses.

6. Funding opportunities

Given the scale and complexity of a longitudinal study this would best be delivered as part of a structured research programme. We see strong alignment with the aims and objectives of the Made Smarter Review and the ongoing Made Smarter Adoption programmes in the UK.

Developing a Digital Readiness Impact Calculator

An original aim of the project was to develop a Digital Readiness Impact Calendar prototype. This would help SME manufacturers to develop an evidence-based business case for investment in digital transformation and to explore different digital transformation scenarios.   Over the course of the project, we evolved our vision for the calculator to focus on existing data obtainable from the digital readiness diagnostic instead of developing a new set of questions based on various digital readiness activities. This reflected a desire to minimise additional data capture and recognised our learnings regarding correlation within each digital readiness theme. Our ideas were also influenced by the lack of before and after data to track how digital readiness and business performance changes over time. Capturing this data would be a powerful tool for decision makers which we consider in our future recommendations below.


We had hoped to see strong evidence of correlation in our initial research and validation data to enable us to design an initial algorithm for our calculator prototype. Work is still ongoing to explore potential formulae but at the time of writing we do not have sufficient evidence to feed into a working calculator tool.


As an interim development stage, a Digital Impact Matrix may be possible. Results from the Digital Impact Survey could be translated into a four-box matrix with companies allocated to the most relevant corner based on their current scores.

Example Digital Readiness / Business Performance Matrix

Dependent variable

Validation Cohort R-squared

Improvers – low/medium digital readiness and medium/high business performance

Characteristics:

Delivering strong results

Continuous improvement culture

Not yet embraced digitalisation

Some resistance to digital transformation


Potential actions:

Build on existing operational and cultural strengths.

Financial incentives may create a catalyst for change.

Explorers – low/medium digital readiness and low/medium business performance

Characteristics:

Start of digital journey

May demonstrate under performance in current KPIs


Potential actions:

Non-digital interventions (e.g., operational efficiencies)

Accelerate results through digital transformation.

Trailblazers – medium/high digital readiness and medium/high business performance

Characteristics:

Enjoying benefits from existing digital solutions

Excellent reference companies and advocates for smart manufacturing


Potential actions:

Further embed digital transformation (e.g., artificial intelligence, distributed ledger technology, quantum computing).

Pathfinders – medium/high digital readiness and low/medium business performance

Characteristics:

Enjoying benefits from existing digital solutions

Excellent reference companies and advocates for smart manufacturing


Potential actions:

Further embed digital transformation (e.g., artificial intelligence, distributed ledger technology, quantum computing).

Digital Impact Pathways for SME Investment

From the Digital Impact Matrix, companies might consider three investment pathways starting from the Explorer box.  

1.

Performance improvement (Improver): Businesses invest in new processes and/or machines as part of continuous improvement and business growth. Whilst this may include use of data and digital technologies, digital readiness is not a consideration. Whilst performance will improve, they are not future-proofing themselves and remain at risk of disruption.

2.

Operations and Technology-led (Pathfinder): Businesses invest in a new technology to solve a specific challenge. They do not take a cross-functional collaborative approach and there may be a temptation to make savings by limiting adoption to a small user group or under-investing in training and development. From a digital readiness perspective improvements may be evidenced in some dimensions only (e.g., Operations, Technology) with little change in others (e.g., People, Partners). Whilst performance may improve in the short-term, they may miss out on longer-term impact.

3.

Balanced investment (Trailblazer): Businesses make investments with consideration of both performance factors and digital readiness. Our core hypothesis set out to demonstrate how this approach is likely to be optimal and should lead to superior longer-term performance and growth.

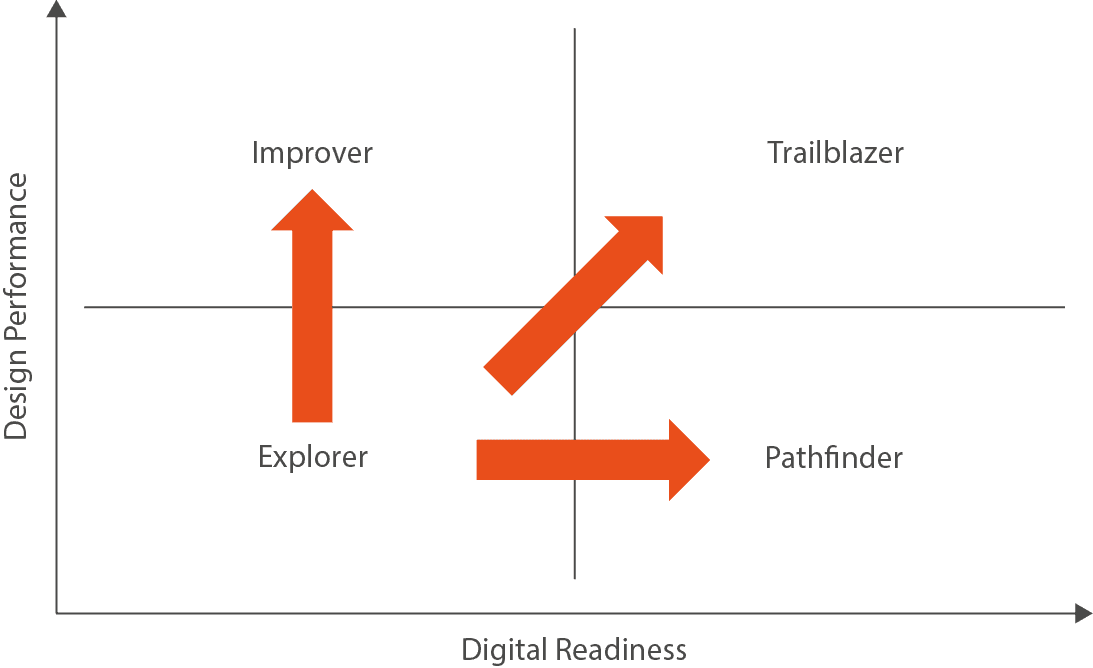
Figure 20 Digital Impact Pathways

We note that this is a simplistic visualisation. However, in the context of an alternative tool, we can use this representation to propose initial digital readiness actions that a business can take to pursue both digital readiness and business performance, aligned to the British Standard PAS 1040.

Acknowledgments

The Digital Readiness Accelerator project was funded by the Made Smarter Innovation | Smart Manufacturing Data Hub.

Want to see our full report? Download below.

Inspiring Digital Breakthrough

EDGE Digital Manufacturing was established in 2018 to promote productivity, resilience and sustainability in the UK Manufacturing sector. EDGE works alongside senior manufacturing leaders to achieve process excellence and organisational development by using data and by adopting digital technologies. EDGE has worked with over 300 SME businesses directly and in partnership with national and regional business support programmes including Made Smarter. EDGE specialises in digital readiness diagnostic tools, strategy and roadmapping services, and supporting in-house digital transformation teams. EDGE’s diagnostic tools have helped over 1000 users begin their Smart Manufacturing journey.